You are here: Getting Started > Using ProModel > Viewing Output
The output generator gathers statistics on each location, entity, resource, path network, and variable in the system. You may, however, turn off reporting capability for any element you do not wish to include. The default level of statistics is at the summary level (i.e., average values, % values, and final values), although detailed history plots can be gathered on such things as utilization, queue fluctuations, and variable values. For more information about viewing the results of a simulation, see Reports and Graphs.
Simulation results may be presented in either tabular or graphic format, including histograms, pie charts, plots and bar graphs. Multiple output results can even be compared on the same chart.
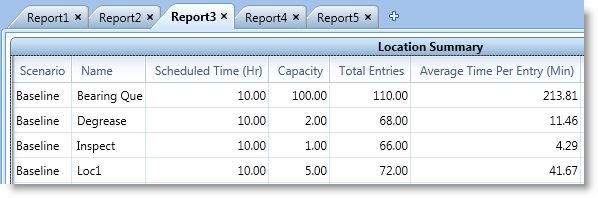
The example below shows a portion of a tabular report for a model.
In addition to the general report shown above, almost all report elements of a model may be displayed graphically. Below is an example of a Single Capacity Locations States Chart.
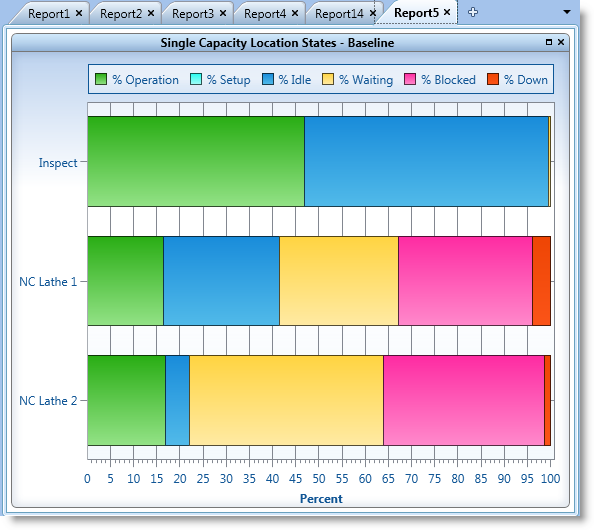
Quickly generate utilization graphs of various types such as the State Chart shown below.
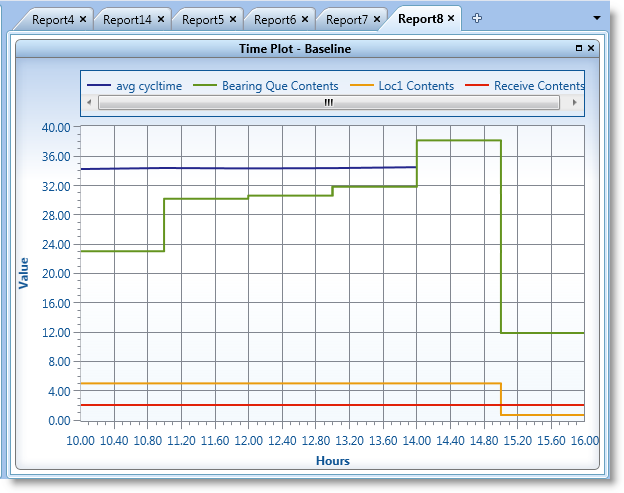
In addition to Category and State Charts, Timeplot Charts, which show variable values as they change over time, can be created.